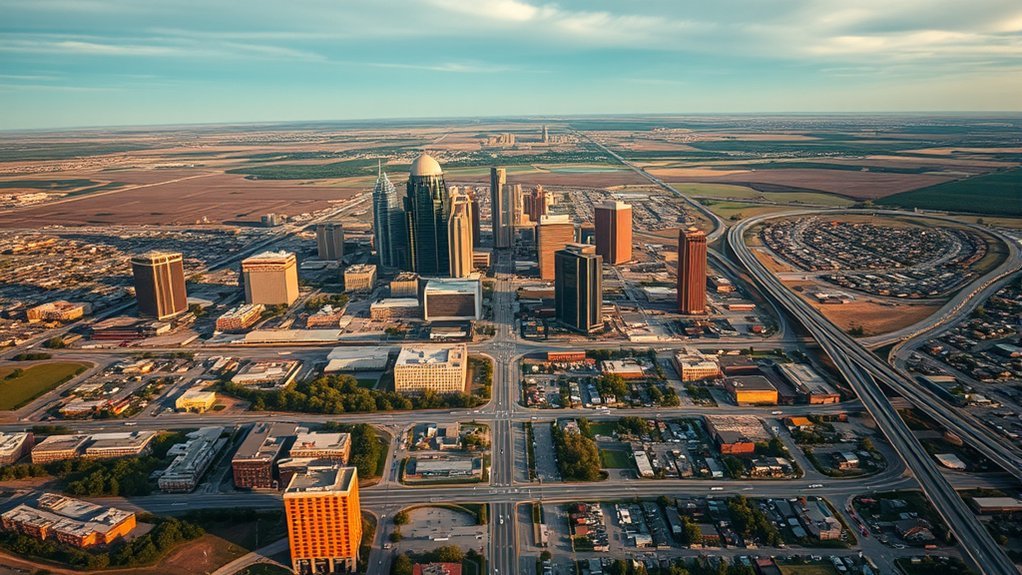
If you’re comparing Oklahoma cities by population, the latest completed U.S. Census Bureau estimates provide a clearer picture than older figures. Oklahoma’s estimated population reached 4,123,288 on July 1, 2025. Oklahoma City remained the state’s largest city at 719,849 residents, followed by Tulsa at 416,209. The same data also shows strong suburban growth around several metro areas and modest declines in some established communities.
Quick Answer
Using U.S. Census Bureau Vintage 2025 estimates, Oklahoma City is Oklahoma’s largest city with 719,849 residents, followed by Tulsa with 416,209. Norman, Broken Arrow, and Edmond complete the top five. Newcastle recorded the strongest 2020-to-2025 percentage growth among Oklahoma places classified as cities.
Key Takeaways
- Oklahoma’s July 1, 2025 population estimate is 4,123,288, up 4.1% from the 2020 estimates base.
- Oklahoma City and Tulsa remain by far the state’s two largest cities.
- Broken Arrow grew about 10.1% from the 2020 estimates base to 2025, while Edmond passed 100,000 residents.
- Newcastle grew about 38.3% over the same period, making it a standout among places classified as cities.
- Enid, Guymon, and Del City are among municipalities that lost population over the 2020-to-2025 period.
What’s the Population Landscape of Oklahoma Like?
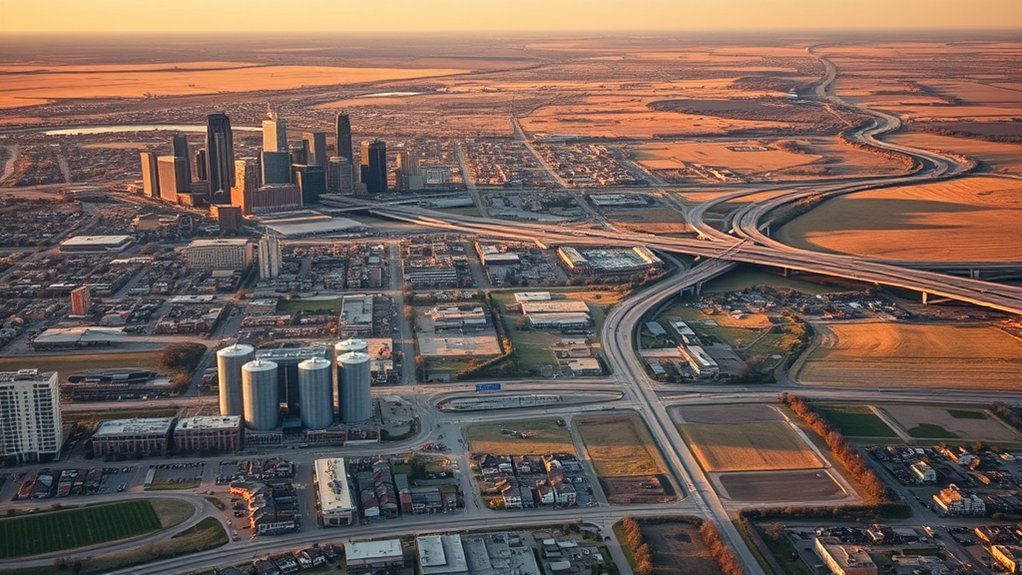
Oklahoma combines large urban centers, fast-growing suburbs, midsize regional cities, and hundreds of small municipalities. According to the U.S. Census Bureau, the state’s population was estimated at 4,123,288 on July 1, 2025. That is 4.1% higher than the April 2020 estimates base.
Oklahoma City had an estimated 719,849 residents in 2025, while Tulsa had 416,209. Their physical layouts differ substantially. Using 2020 Census geography, Tulsa had a population density of 2,091.1 people per square mile, compared with 1,123.5 in Oklahoma City.
Note: A decennial Census count and an annual population estimate are not the same thing. Oklahoma’s official April 1, 2020 Census population was 3,959,353. The Census Bureau later produces annual estimates, and each new estimate vintage can revise earlier years in the series. Vintage 2025 is the latest completed city-and-town series available as of 2026.
Oklahoma’s estimated population increased 4.1% from the April 2020 estimates base to July 1, 2025.
Demographic Insights: Who Lives in Oklahoma?
Population totals tell only part of the story. Oklahoma’s current demographic profile includes children, working-age adults, a growing older population, and residents from a wide range of racial and ethnic backgrounds. Current Census QuickFacts data shows that 23.2% of residents are under age 18, 18.0% are age 65 or older, and 50.5% are female.
Population Distribution Trends
Oklahoma has grown beyond its 2020 Census count of 3,959,353 residents, reaching an estimated 4,123,288 by July 1, 2025. Growth is not evenly distributed. Large cities such as Oklahoma City continue to add residents, while several suburban communities have grown faster on a percentage basis and some municipalities have declined.
Education and income indicators add context to these trends. According to current Census QuickFacts, 89.4% of Oklahomans age 25 and older have completed high school or a higher level of education, while 28.3% hold a bachelor’s degree or higher. The statewide poverty rate is 14.9%.
Age Demographics Overview
Oklahoma’s age profile affects schools, housing, transportation, health services, and local government planning. Current statewide figures include:
- Under age 18: 23.2% of residents.
- Age 65 and older: 18.0% of residents.
- Female residents: 50.5% of the population.
These percentages show that Oklahoma must plan for both families with children and a substantial older population. The balance differs from one city to another, so statewide percentages should not be assumed to describe every community.
Racial and Ethnic Composition
Oklahoma has a diverse racial and ethnic population. Current Census QuickFacts reports the following statewide percentages:
| Racial/Ethnic Group | Percentage |
|---|---|
| White alone | 69.1% |
| Black alone | 7.9% |
| American Indian and Alaska Native alone | 9.4% |
| Asian alone | 2.8% |
| Two or More Races | 10.6% |
| Hispanic or Latino | 14.0% |
Hispanic or Latino is an ethnicity rather than a race in Census reporting, so people counted as Hispanic or Latino may also appear within one of the racial categories above. For that reason, the Hispanic percentage should not simply be added to the race percentages.
Top 10 Largest Cities in Oklahoma
The Census Bureau’s Vintage 2025 city and town estimates provide a consistent way to rank Oklahoma’s largest incorporated cities. The table below compares the July 1, 2025 estimate with the April 1, 2020 estimates base.
| Rank | City | 2025 Estimate | 2020 Estimates Base | Change |
|---|---|---|---|---|
| 1 | Oklahoma City | 719,849 | 680,936 | +5.7% |
| 2 | Tulsa | 416,209 | 413,093 | +0.8% |
| 3 | Norman | 130,943 | 127,973 | +2.3% |
| 4 | Broken Arrow | 124,991 | 113,552 | +10.1% |
| 5 | Edmond | 100,479 | 94,423 | +6.4% |
| 6 | Lawton | 90,503 | 90,379 | +0.1% |
| 7 | Moore | 63,609 | 62,814 | +1.3% |
| 8 | Midwest City | 58,799 | 58,405 | +0.7% |
| 9 | Enid | 50,297 | 51,260 | -1.9% |
| 10 | Stillwater | 50,046 | 48,350 | +3.5% |
Oklahoma City is nearly 304,000 residents larger than Tulsa based on the 2025 estimates. Broken Arrow recorded one of the strongest growth rates among the top ten, while Edmond crossed the 100,000-resident mark. Enid was the only city in the current top ten with a cumulative decline from its 2020 estimates base.
Growth Trends in Oklahoma’s Fastest Growing Cities
Population growth depends on the period and geographic definition being measured. For a consistent comparison, the figures below use the Census Bureau’s April 1, 2020 estimates base and July 1, 2025 estimate.
Key Growth Drivers
The population estimates show where growth occurred, but they do not by themselves prove why residents moved. Factors such as housing availability, access to jobs, transportation links, new development, schools, and local amenities can influence growth. Those causes should be evaluated separately rather than inferred from population numbers alone.
Suburban and exurban communities around Oklahoma’s major employment centers have produced some of the strongest percentage increases. This pattern is especially visible around the Oklahoma City and Tulsa regions.
Emerging Urban Areas
Several Oklahoma cities recorded strong cumulative growth between the 2020 estimates base and 2025:
- Newcastle: 10,989 to 15,198, an increase of about 38.3%.
- Piedmont: 7,397 to 9,427, an increase of about 27.4%.
- Collinsville: 7,933 to 9,956, an increase of about 25.5%.
- Mustang: 19,917 to 24,571, an increase of about 23.4%.
- Yukon: 23,635 to 27,615, an increase of about 16.8%.
- Owasso: 38,271 to 43,117, an increase of about 12.7%.
Note: Percentage growth can look dramatic in very small communities because a relatively small number of new residents can produce a large rate increase. Compare both the percentage and the actual number of residents added.
Cities With Declining Populations: a Closer Look
Not every Oklahoma municipality grew between the April 2020 estimates base and July 2025. Several communities experienced measurable declines:
- Enid: 51,260 to 50,297, a decline of 963 residents, or about 1.9%.
- Guymon: 12,972 to 12,241, a decline of 731 residents, or about 5.6%.
- Del City: 21,811 to 21,138, a decline of 673 residents, or about 3.1%.
- Weatherford: 12,056 to 12,005, a decline of 51 residents, or about 0.4%.
Lawton requires more nuance than the older figures suggested. Its population moved up and down during the period, but the 2025 estimate of 90,503 is slightly above its 2020 estimates base of 90,379. It therefore should not be described as having a cumulative 2020-to-2025 population decline.
Population losses can affect local tax bases, housing demand, school enrollment, infrastructure planning, and business activity. However, population estimates alone do not identify the cause of a decline, so economic or social explanations should be supported with separate evidence.
Housing Market Trends in Oklahoma Cities
Housing costs vary substantially across Oklahoma’s major cities. Unlike population estimates, home sale prices can move from month to month, so the source and period matter. Redfin’s city-level market pages reported the following median sale prices for the three-month period ending June 2026:
| City | Approx. Median Sale Price |
|---|---|
| Oklahoma City | $270,000 |
| Tulsa | $254,000 |
| Norman | $284,000 |
| Edmond | $389,000 |
| Lawton | $165,000 |
Among these cities, Edmond had the highest recent median sale price, while Lawton had the lowest. Norman and Oklahoma City were in the middle of the group. These figures describe recent sales rather than long-term home values and can change quickly as new transactions enter the data.
Census housing statistics measure different things. For example, Census QuickFacts reports median values for owner-occupied housing units, median gross rent, and owner costs. Those measures should not be presented as current median sale prices.
Frequently Asked Questions
What Are the 10 Most Populated Cities in Oklahoma?
Using July 1, 2025 Census estimates, the ten largest Oklahoma cities are Oklahoma City, Tulsa, Norman, Broken Arrow, Edmond, Lawton, Moore, Midwest City, Enid, and Stillwater, in that order.
What Is the Fastest Growing City in Oklahoma?
Using cumulative growth from the April 2020 Census estimates base to July 2025 and limiting the comparison to places classified as cities, Newcastle stands out with growth of about 38.3%, increasing from 10,989 to 15,198 residents.
What’s the Best City to Live in In Oklahoma?
There is no single objectively best Oklahoma city. The right choice depends on priorities such as housing cost, commute, schools, jobs, nightlife, outdoor recreation, and preferred community size. Census population data can compare city size and demographics, but it does not rank quality of life.
What Is the Least Populated City in Oklahoma?
The answer depends on terminology. In the Census Bureau’s 2025 incorporated-place estimates, Cooperton town had an estimated population of 4. Among places specifically classified as cities, Centrahoma had an estimated 82 residents. Guthrie, by comparison, had an estimated population of 12,257 and is not close to being Oklahoma’s smallest city.
How Often Are Oklahoma City Population Estimates Updated?
The Census Bureau releases annual population estimates. When a new vintage is released, estimates for earlier years since the most recent decennial Census may also be revised. Vintage 2025 is the latest completed city-and-town series available as of 2026.
Why Do Different Websites Show Different Population Numbers?
Some pages use the official 2020 Census count, while others use annual estimates from 2021, 2022, 2023, 2024, or 2025. Census estimate vintages can also revise previous years, so two sources may show different numbers even when both originally came from the Census Bureau.
Is a City’s Population the Same as Its Metro Population?
No. A city population counts residents inside the incorporated city boundaries. A metropolitan area generally includes the central city plus surrounding counties and communities tied to it through employment and commuting patterns. Metro population figures are therefore usually much larger.
Conclusion
Oklahoma’s population landscape includes both steady urban growth and major differences between individual communities. Vintage 2025 Census estimates place Oklahoma City first at 719,849 residents and Tulsa second at 416,209, while Broken Arrow, Edmond, Newcastle, Mustang, Yukon, and other growing communities show how population is shifting within the state. At the same time, places such as Enid, Guymon, and Del City have experienced declines. Using a consistent Census vintage, clearly defined time period, and correctly sourced housing data makes these comparisons far more useful.
Sources
- U.S. Census Bureau QuickFacts: Oklahoma — statewide population, age, race, education, housing, and poverty data.
- U.S. Census Bureau City and Town Population Totals: 2020–2025 — current incorporated-place estimates, rankings, and growth comparisons.
- U.S. Census Bureau QuickFacts: Oklahoma City — Oklahoma City population and density figures.
- U.S. Census Bureau QuickFacts: Tulsa — Tulsa population and density figures.
- Redfin Housing Market Data — methodology and frequently updated housing-market statistics used for the recent city sale-price comparisons.